


Protecting public health and the environment, empowering communities, standing up to polluters; these things require a firm grasp of the facts.
That’s why the Environmental Integrity Project prioritizes gathering, analyzing, and sharing data. We aim to make our data as accessible as possible, so that anyone interested—academics, community activists, government officials—can use it to answer questions and help hold polluters and governments accountable.
Oil & Gas Watch is a free, public inventory that tracks this rapid expansion of oil, gas, and petrochemical infrastructure throughout the United States.
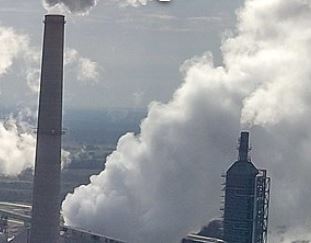
To provide convenient public access to state air pollution emissions data, EIP created a map database with the most recent state emissions inventories.
EIP developed free, public, and interactive tools to track fenceline benzene concentrations measured at petroleum refineries starting in 2018.
EIP built a free, public, machine-readable database that contains monitoring results from over 443 annual groundwater monitoring reports posted online by 265 regulated coal plants and coal ash dumps in 2018.
EIP has prepared several mapping tools, reports, fact sheets, articles, and a compilation of public records to inform communities, the public, and decision-makers about the risks of carbon capture, use, and sequestration and gaps in current laws and regulations that govern it.
Ashtracker provides public access to industry-reported data from state and company records about groundwater contamination at coal ash dumps.
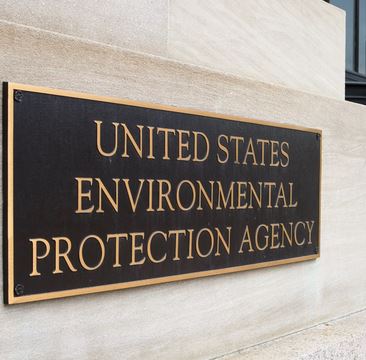
Links to various documents EIP has requested from the EPA and analyses of the Agency’s actions.
This inventory includes 131 existing plastics plants that manufacture key polymer resins, plants that manufacture the main chemical ingredients for polymer resins, plants that manufacture catalysts used in plastics production, and proposed expansions and new facilities.
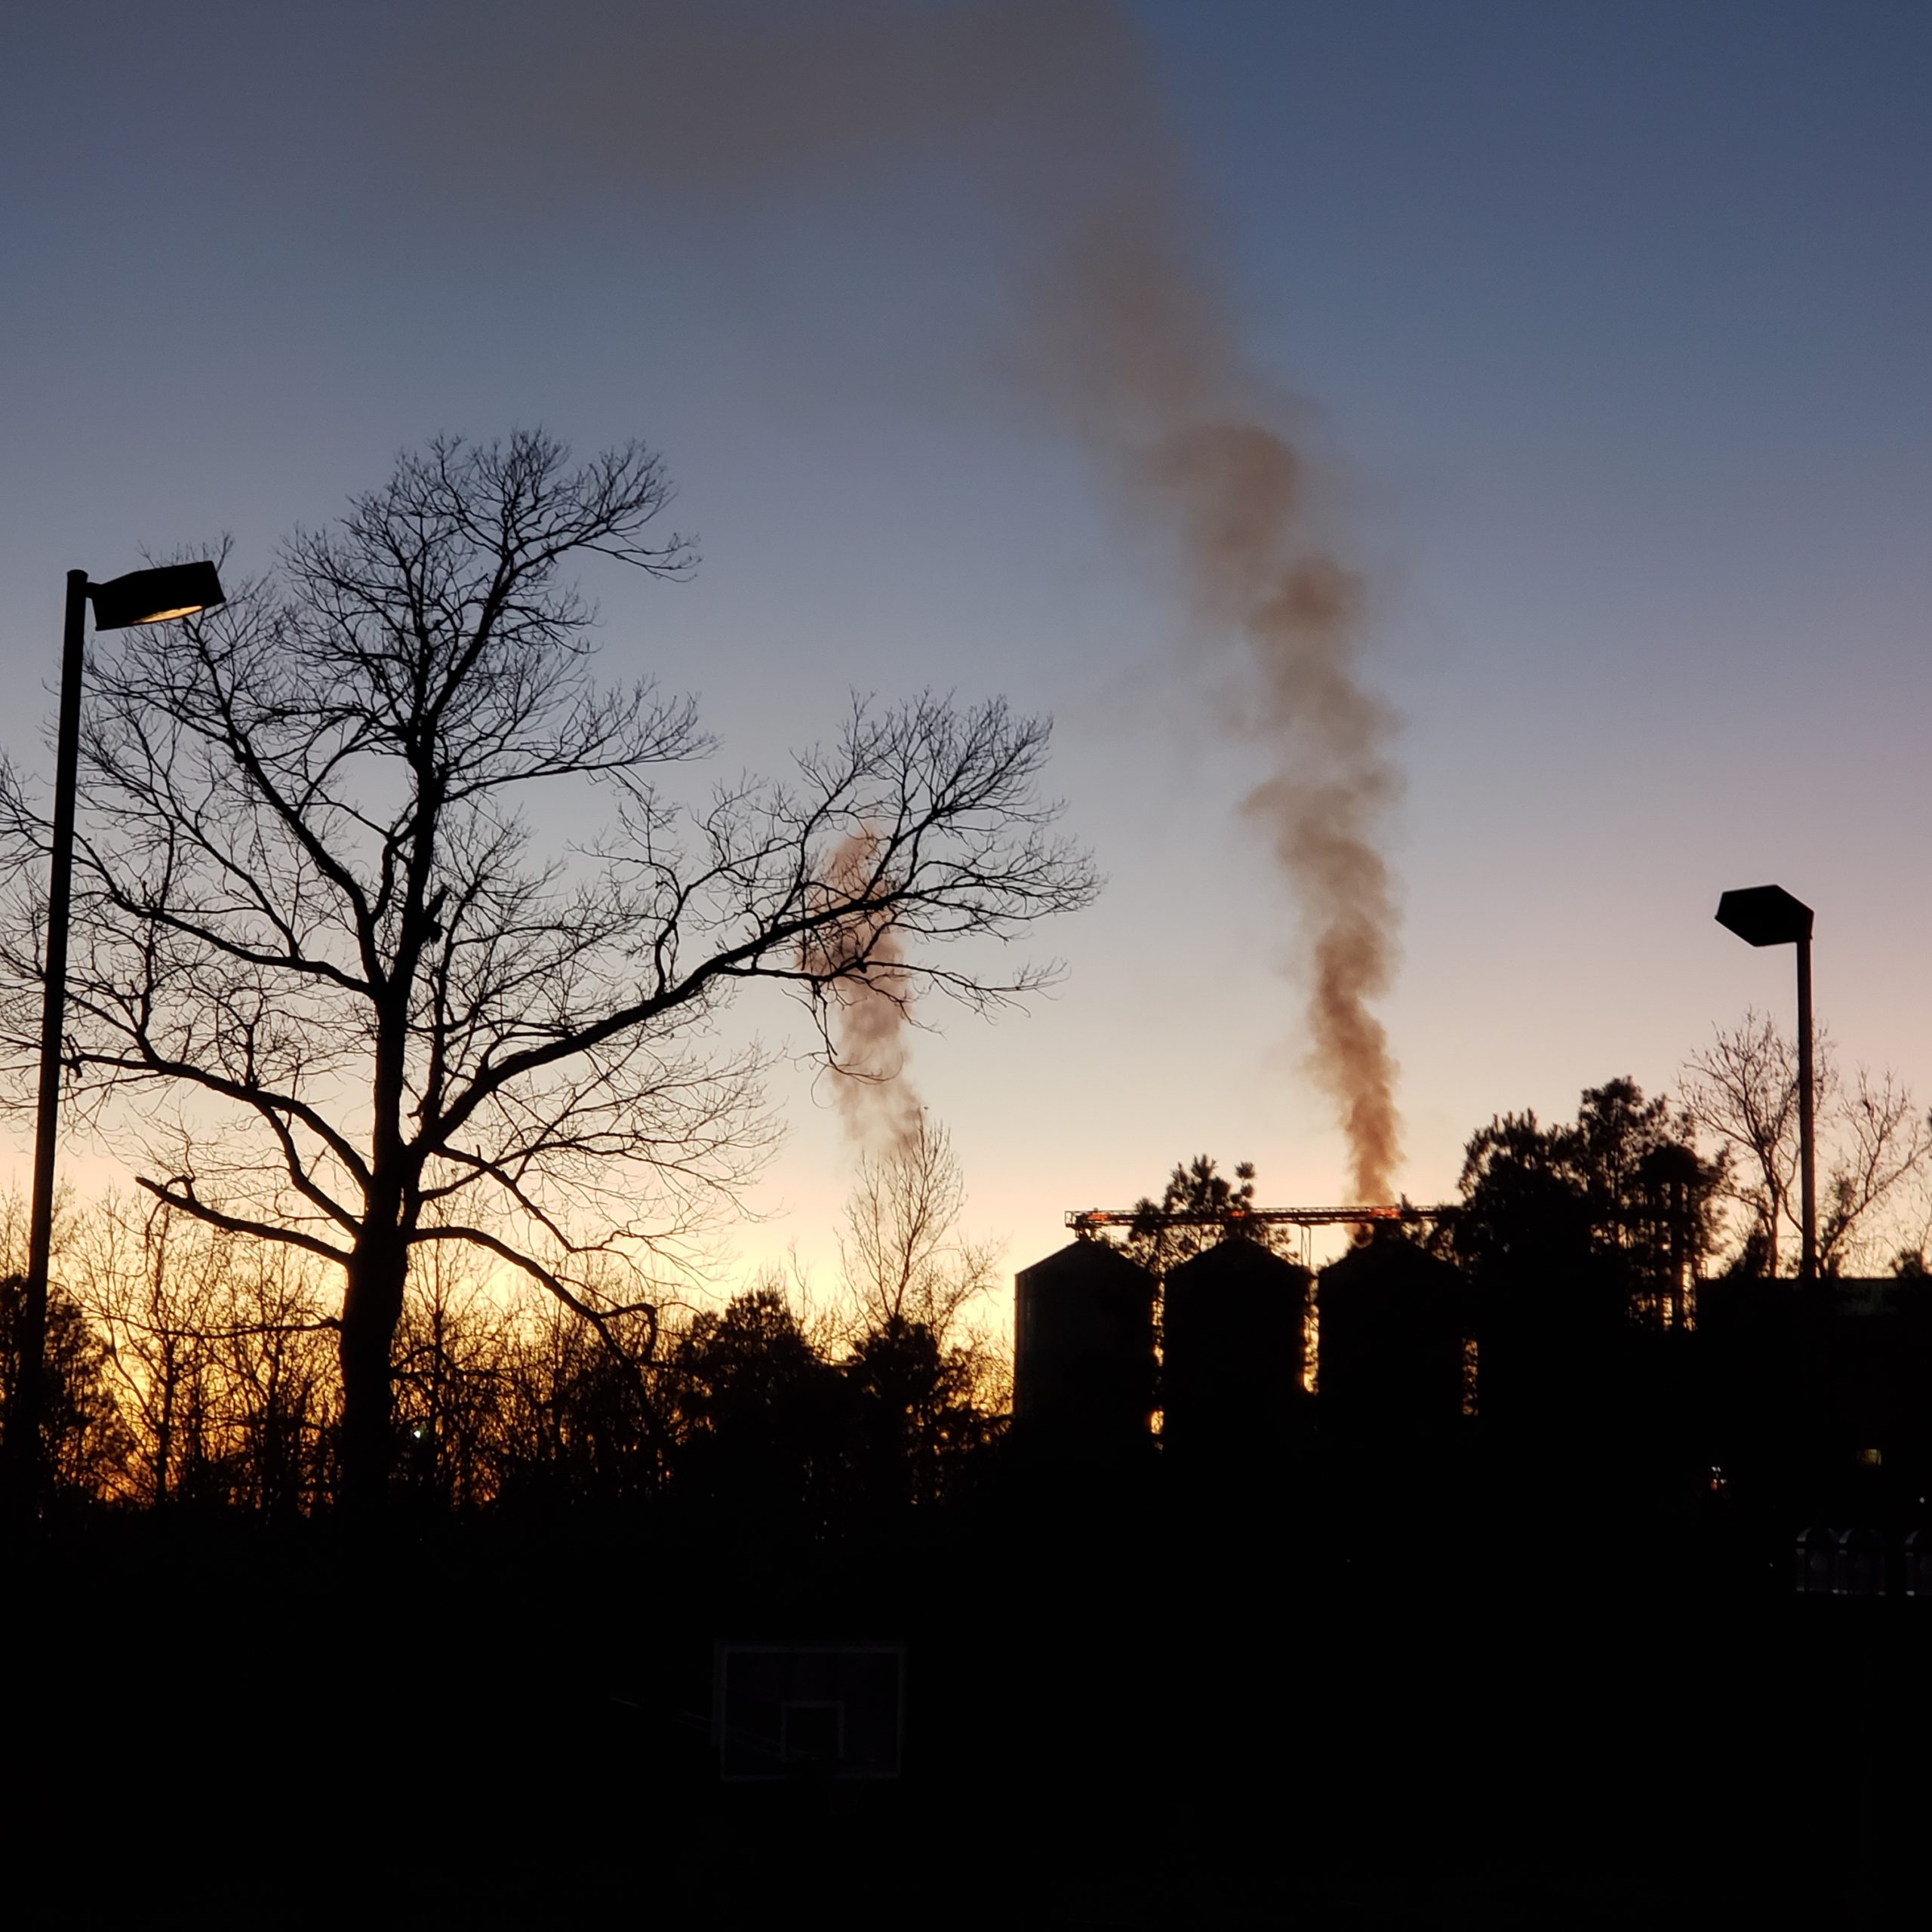
EIP issued a series of reports spotlighting facilities that are operating outdated boilers or heaters (those that are over 15 years old) and could be considered for replacement with cleaner technologies, fuel switching, or other upgrades to reduce emissions.
This interactive map shows where the Virginia Department of Environmental Quality’s water monitoring found E. coli concentrations higher than the Environmental Protection Agency’s Beach Action Value. EPA recommends warning swimmers about potential health risks when E. coli concentrations exceed this threshold.
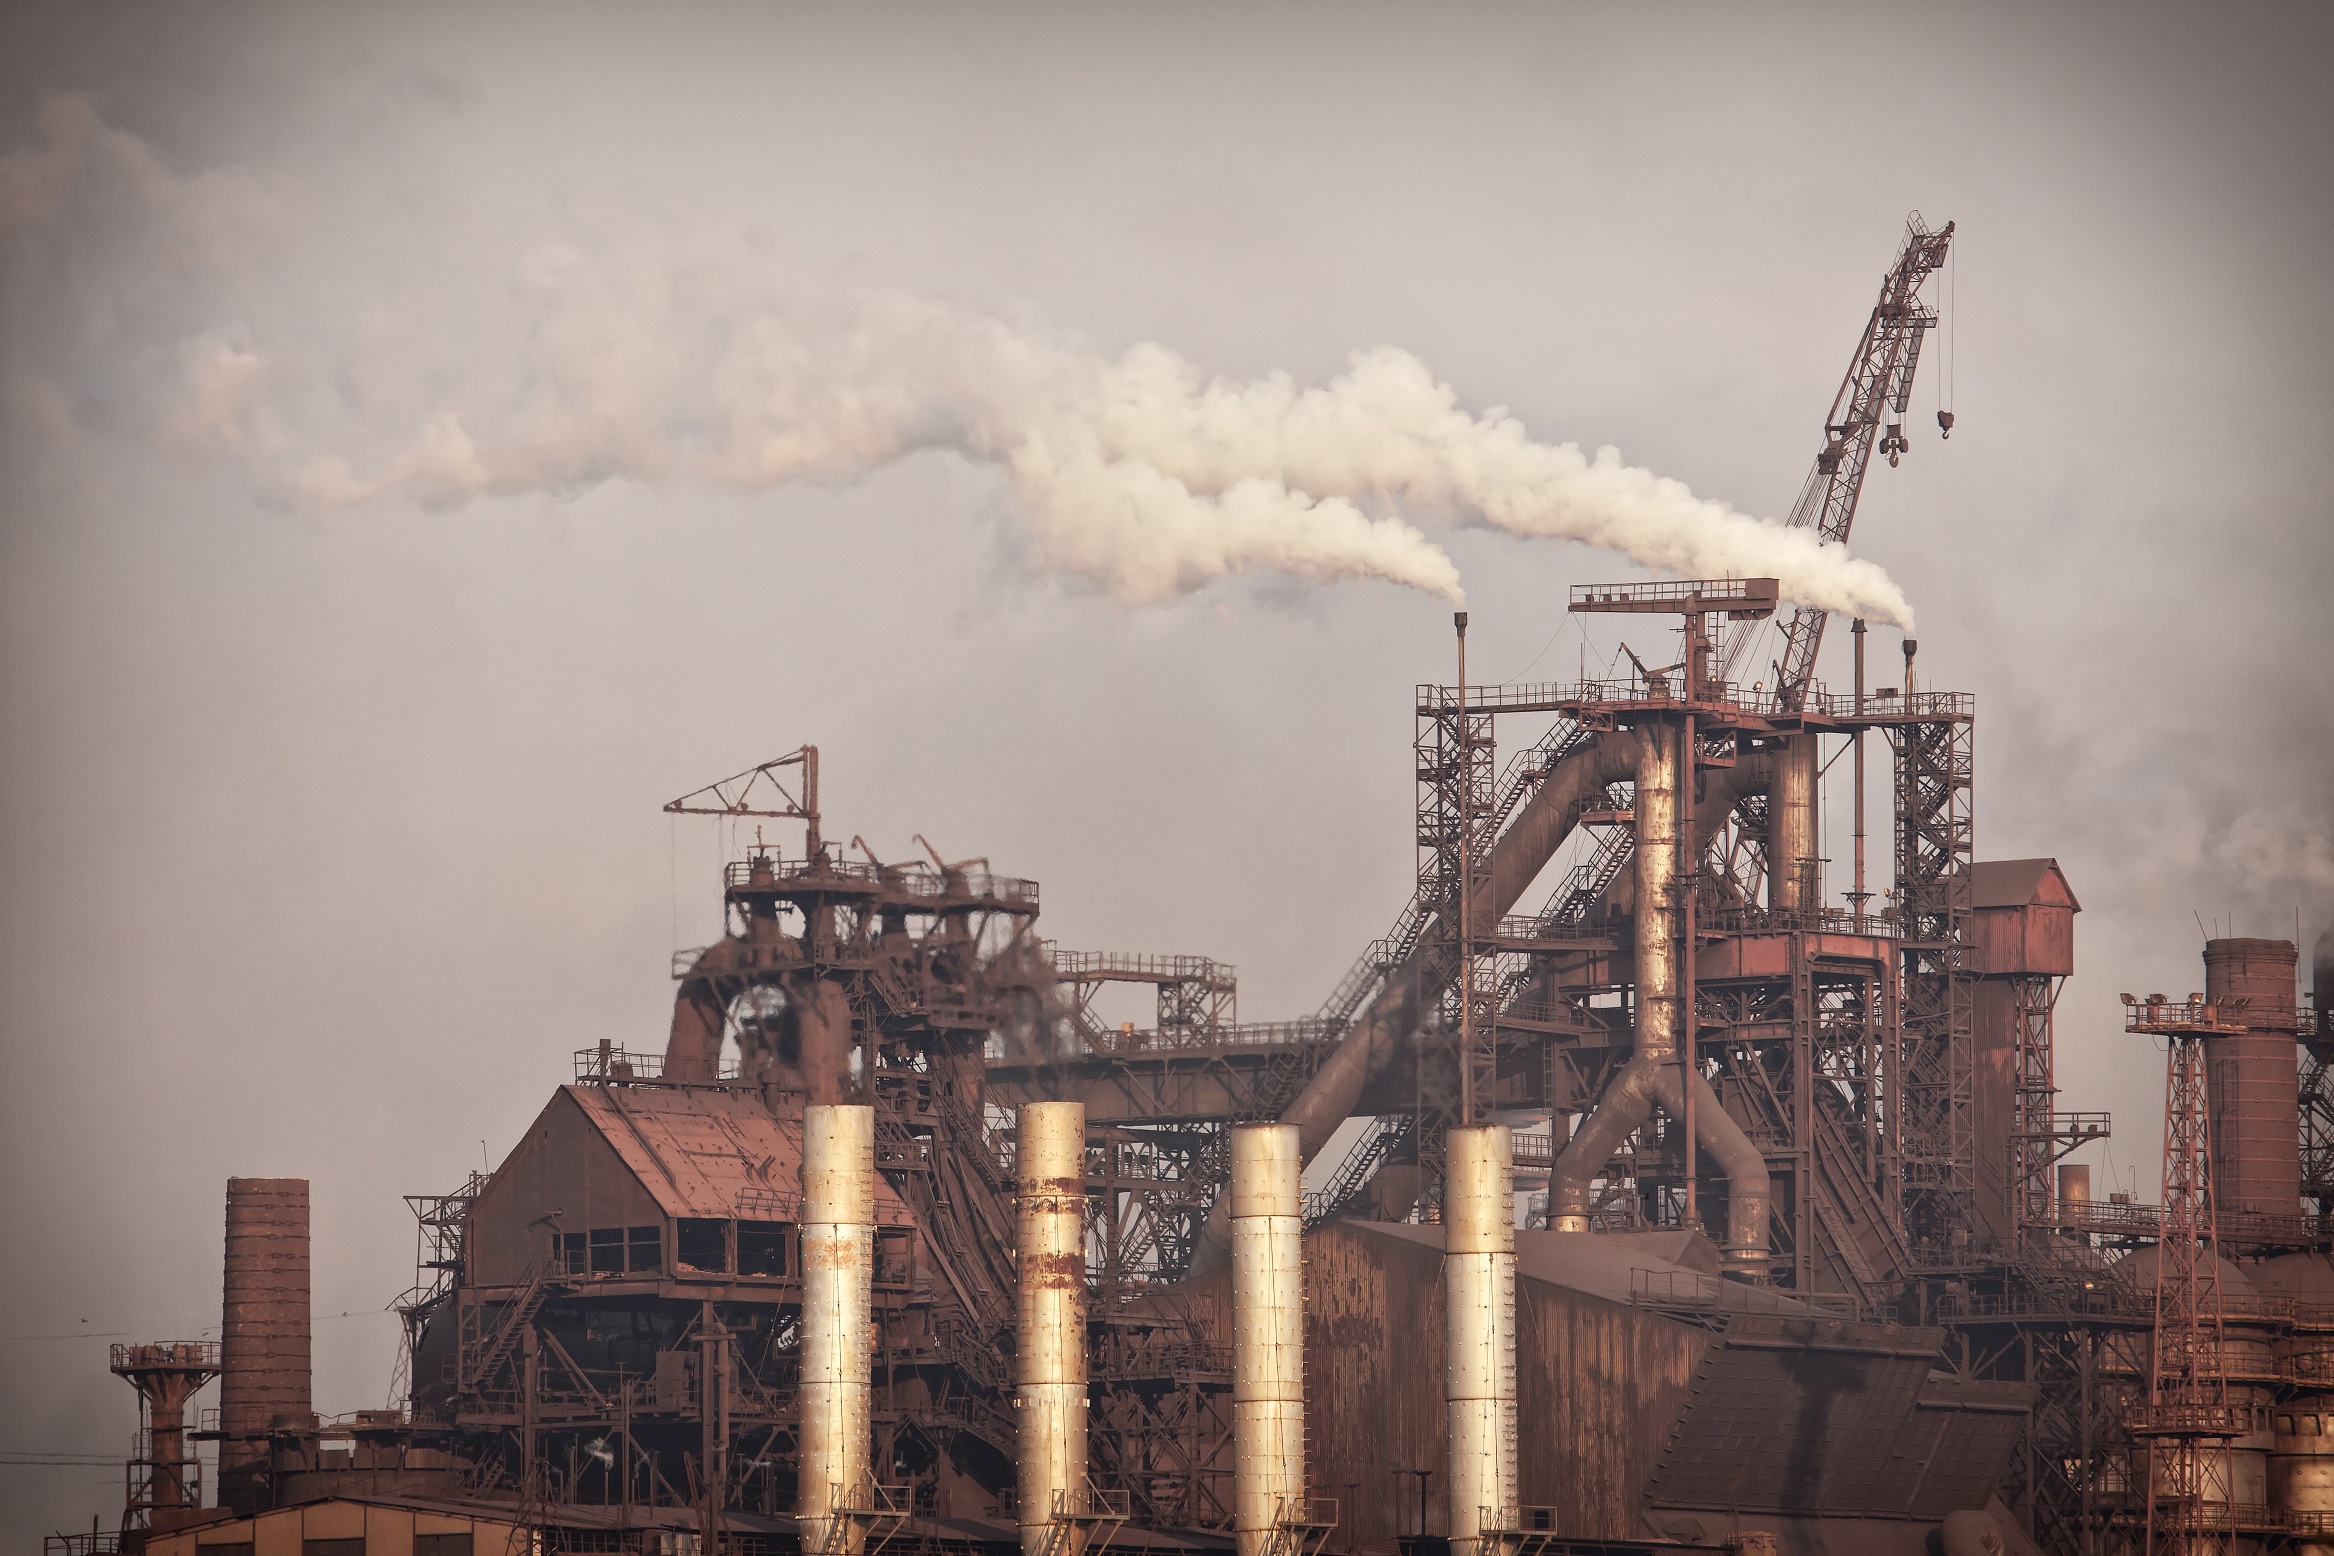
This interactive inventory highlights 21 steel mill and coke oven facilities, their Clean Air Act and Clean Water Act compliance status, access to current and pending permit documents, air emissions data, and links to other websites and resources of interest.
In March 2024, EPA Administrator Lee Zeldin extended an offer to industrial sources of hazardous air emissions that would allow emitters to release hazardous air pollution, without the need to comply with clean air standards. This map shows the locations of these industrial sources, and whether they have requested or been granted a pollution exemption.