
Ozone at several Houston area air pollution monitors hit levels in 2015 that have not been seen since 2007, with some monitors directly downwind of the Ship Channel recording levels not seen in about a decade. Increased production at petrochemical plants, and growth in storing and shipping of petroleum products along the Ship Channel, driven by cheap and plentiful oil and gas, may be responsible for the increase in ozone pollution. The spike in 2015 ozone levels point to the need for stricter enforcement of existing air pollution laws and the use of more advanced monitoring technologies, which will help the Houston area return to the downward trend in ozone levels.
Houston’s ozone pollution, commonly called smog, is typically formed when chemicals released mainly from refineries, petrochemical plants, and storage terminals along the Houston Ship Channel mix with other compounds in the air on warm, sunny days.
Ozone pollution can trigger asthma attacks and other respiratory problems, and it is especially dangerous for people with asthma, children, and the elderly.
Houston has long struggled with ozone pollution, gaining a reputation as one of the smoggiest cities in the U.S. Houston area ozone levels have been dropping since 2000, due mainly to federal air pollution rules that have forced emission reductions from most major refineries and chemical plants, although many large air pollution sources have escaped regulatory scrutiny even as they have expanded their production. Ozone levels have also declined as a result of voluntary measures – such as reduced driving and vehicle idling – that Houstonians have made to try to meet federal health-based air quality standards.
But, 2015 levels are back up. At certain monitors ozone levels in 2015 reached levels not recorded since 2007. In addition, monitors in downtown, north, and northwest Houston reached levels not seen in a decade or more.
- The ozone monitor in downtown Houston registered a high of 85 parts per billion, which is the highest level since 2004.
- The Aldine monitor registered a level of 95 parts per billion, which was the highest in the area, and a level not seen since 2004.
- The Lang Road monitor registered 91 parts per billion, a level not seen since 2000.
Ilan Levin, Associate Director, Environmental Integrity Project said: “The numbers show that Houston still has a very serious smog problem. Houston’s refineries and petrochemical plants have been working overtime to take advantage of cheap and abundant oil and gas. And, we’ve seen unprecedented growth in the storage and shipping of petroleum products in and out of the Ship Channel. Lax regulation at the state level means more air pollution from refineries, chemical plants, and oil and gas storage facilities. That translates to more ozone in Houston. The good news is that there are some common-sense steps, including stricter enforcement of the laws that are already on the books, and the use of robust new monitoring technologies that would allow industries to identify and stop the air pollution leaks that contribute to Houston’s smog problem.”
Adrian Shelley, Executive Director, Air Alliance Houston, said: “We are concerned about potential negative health impacts to everyone in the Houston region due to high ozone pollution. Ozone affects everyone in the Houston region. This year we saw high ozone levels recorded in the middle of downtown Houston and in neighborhoods to the north and northwest. This is a public health problem for all Houstonians, not just people living near the Ship Channel and in east Houston neighborhoods.”
The following detailed analysis, by the nonprofit groups the Environmental Integrity Project and Air Alliance Houston, is based on data obtained from the Houston Advanced Research Center (www.harc.edu.) and on research from Rice University.
Rice University Research Shows that Asthma and Heart Attack Risks Increase When Ozone Levels are Up
Rice University’s Katherine Ensor and Loren Raun are conducting research into the acute health effects of ambient air pollution on Houston residents.
Katherine Ensor, Professor of Statistics at Rice University’s School of Engineering said: “When ambient ozone levels are between 50 to 70 parts per billion the increased risk of an asthma attack is 10 percent for exposure of one day and 13 percent for a period of three day exposure. However, if we move to higher levels of ozone in the range of 70 to 90 parts per billion, the risks increase to 21 percent for one-day exposure and 45 percent if individuals are exposed for three days to elevated ozone levels. For heart patients, the concern is a three-hour window of elevated ozone levels. A 20 part per billion increase in ozone levels resulted in a 4 percent increase in risk of cardiac arrest. The cardiac arrest impact is greatest when the ozone levels are above 75 parts per billion.”
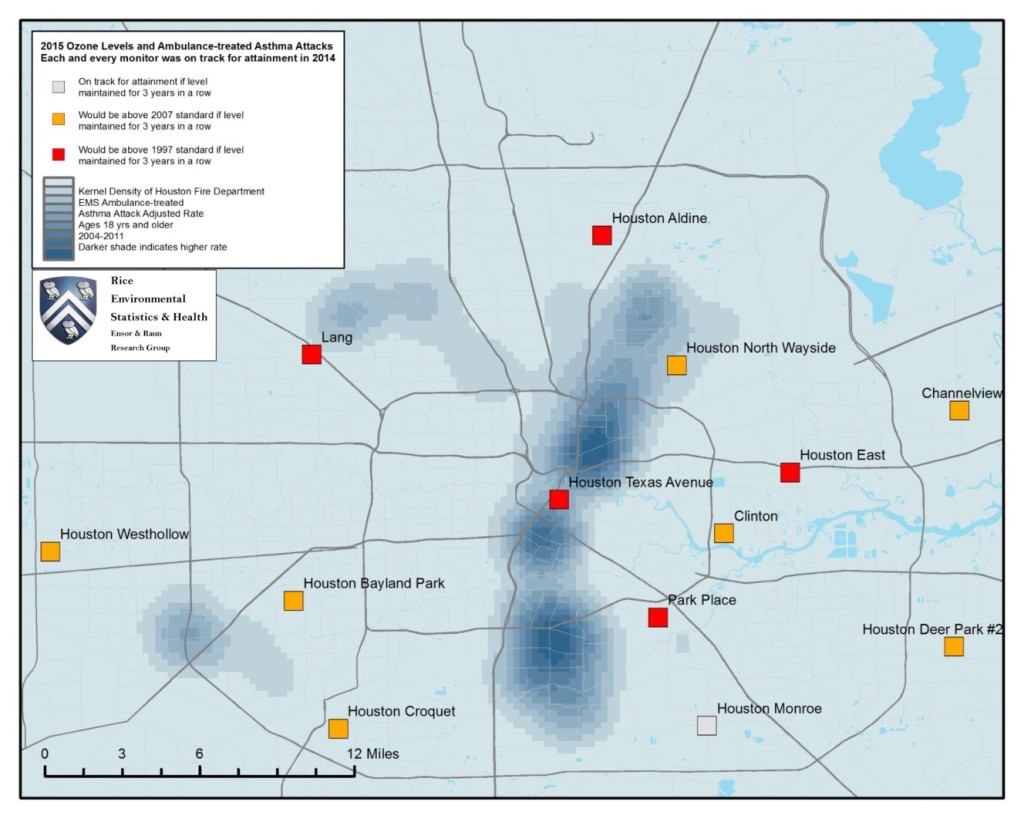
The figure below highlights the region of the City where residents experience they greatest rate of uncontrolled asthma attacks. The map includes the location of the ozone monitors discussed in this report. Details of the Rice studies can be found on the Rice Environmental Statistics and Health Research group website http://ensorgroup.blogs.rice.edu/research/.
Houston Advanced Research Center Analysis Shows 2015 Ozone Levels at 19 out of 22 Air Pollution Monitors Are Over 75 Parts Per Billion.
Ozone Monitors North and Northwest of Downtown Hit Levels Greater than 90 Parts Per Billion.
According to data analysis prepared by HARC, Houston’s ozone levels have declined over time, but with notable spikes in some years. Levels fell starting in 2000, but rose between 2002 and 2005. There were dramatic declines in the mid-2000s, but levels rose again from 2010 to 2011. After 2011, Houston’s air pollution monitors recorded a decline in ozone, continuing the long-term downward trend. However, the most recent data show that 2015 ozone levels are up at levels not seen in several years. The following charts and data table were prepared by HARC as part of a late-October regional air quality planning committee meeting. The complete HARC presentation is available at:
http://www.h-gac.com/taq/airquality/raqpac/documents/2015/October%2029/10-29-2015%20Presentation%20-%20VOC%20Flux%20Measurements%20with%20DIAL%20and%20SOF.pdf
Chart 1: Number of High Ozone Days in the Houston Area
(All Monitors)
Source: Alex Cuclis, Research Scientist, Houston Advanced Research Center
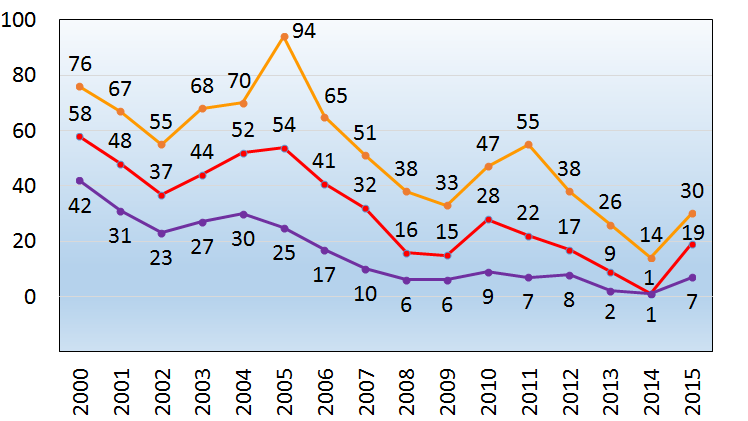
The Y-axis in the chart above shows the number of high ozone days recorded at all the air pollution monitors in the Houston area – the “regulatory monitors” that state and federal regulators rely on, as well as “non-regulatory” monitors that scientists and health professionals use. The X-axis shows the number of days ozone levels exceeded 75 parts per billion (the yellow line); 84 parts per billion (the red line), and 124 parts per billion (the purple line).
Chart 2: Ozone Levels in the Houston Area
(Regulatory Monitors Only)
Source: Alex Cuclis, Research Scientist, Houston Advanced Research Center

The Y-axis in the chart above represents the ozone level (parts per billion) based on all regulatory monitors. The “design value” (red line) is a three-year average, which is what state and federal officials use to determine compliance with health-based ozone standards. The blue line represents the annual average of the fourth highest level recorded at each monitor; the three highest ozone levels at every monitor are thrown out to avoid outliers and to reduce variations due to weather. The chart plot is based on the following data:
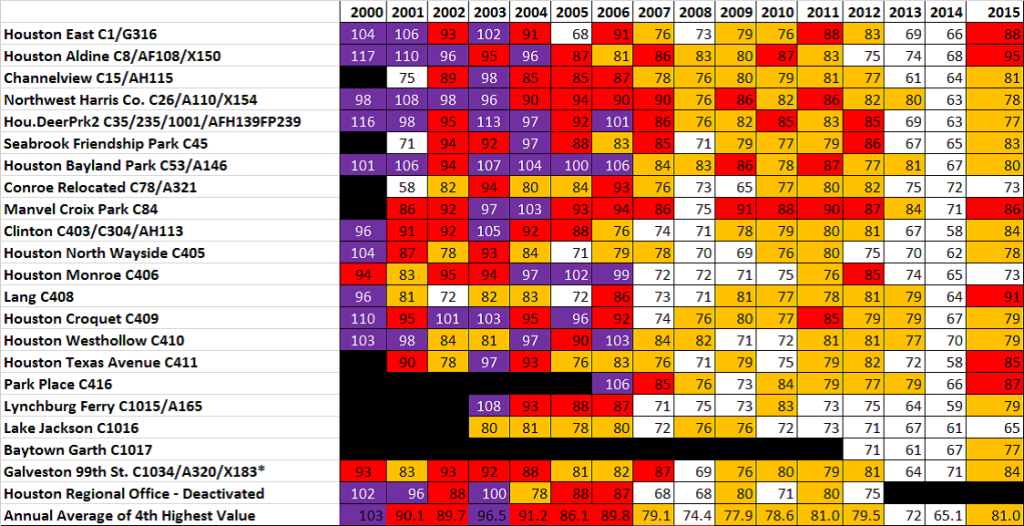
As shown in the table above, six monitors in the Houston area recorded ozone levels greater than 84 parts per billion (the values highlighted in red) – something that has not happened since 2007. (84 parts per billion is the value that the federal government used to determine compliance with the 1997 health-based ozone standard.)
The detailed data confirm that, while Houstonians have made significant improvements in ozone reductions since 2000, Houston is not out of the woods. In fact, 2015 smog levels are the worst in several years.
For 2015, all of Houston’s regulatory ozone monitors, together, averaged 81 parts per billion, which is roughly the same level averaged over all of Houston’s monitors in 2011. Weather is a major factor in ozone formation, and 2011 was a warm year with many stagnant and rain-free days, which contributed to high ozone levels. Ozone levels in 2014 were relatively low, and Houstonians have reason to celebrate the overall downward trend. The general decline in ozone levels through 2014 are due in part to emission reductions that industries in the Ship Channel area have made by using infrared cameras to detect air pollution leaks that would otherwise go unnoticed.
Conclusions
The EPA’s health-based standard, above which the air is considered to be unhealthy to breathe, was set in 2008 at 75 parts per billion. On October 1, 2015, EPA strengthened the ozone standard to 70 parts per billion, based on extensive scientific evidence about ozone’s effects on public health. In 2015, most of Houston’s air pollution monitors exceeded both the older 2008 and the newer 2015 EPA standard.
Texas is home to several of the largest oil refineries in the U.S., including ExxonMobil’s Baytown refinery, and Marathon Oil’s Galveston Bay (formerly BP Texas City) refinery. Houston area oil refineries and petrochemical plants have undergone major expansions, to take advantage of the shale oil and natural gas boom. (Chemical manufacturers use natural gas both as a fuel and a feedstock to make their products.) For example, ExxonMobil’s Baytown complex began a major expansion in 2014. Low oil and gas prices have also spurred major growth for terminals at the Port of Houston and along the Ship Channel that store and ship petroleum products, such as the ongoing expansion of Kinder Morgan’s Galena Park Terminal.
Emission inventories – the total amount of air pollutants that industries report to the state environmental agency – are not yet publicly available for 2015. But, all indications are that the industries driven by cheap and abundant oil and gas, including refineries, petrochemical, and bulk petroleum storage and shipping are the major contributor to this year’s spike in Houston smog. Numerous studies using state-of-the-art pollution monitoring techniques show that Houston Ship Channel industries are under-reporting emissions of volatile organic compounds that are a key ingredient in ozone.
Strict enforcement of federal air pollution rules and robust monitoring at refineries, petrochemical plants, and petroleum and chemical storage tanks along the Houston Ship Channel would help bring Houston’s smog problem under control.
Air Alliance Houston, in collaboration with the University of Houston, maintains a map of ozone pollution levels in Houston. Houstonians throughout the region can check houstoncleanairnetwork.org for real-time ozone pollution information.
About the Groups:
The Environmental Integrity Project is a nonprofit dedicated to strict enforcement of anti-pollution laws, including the public’s right to know how refineries and petrochemical plants affect our health and air quality.
Air Alliance Houston is Houston’s clean air and public health nonprofit advocacy organization. Their vision is clean air so our economy, quality of life, and children can thrive.
###
CONTACT
Ilan Levin, Environmental Integrity Project, (512) 619-7287
Adrian Shelley, Air Alliance Houston, (713) 528-3779